
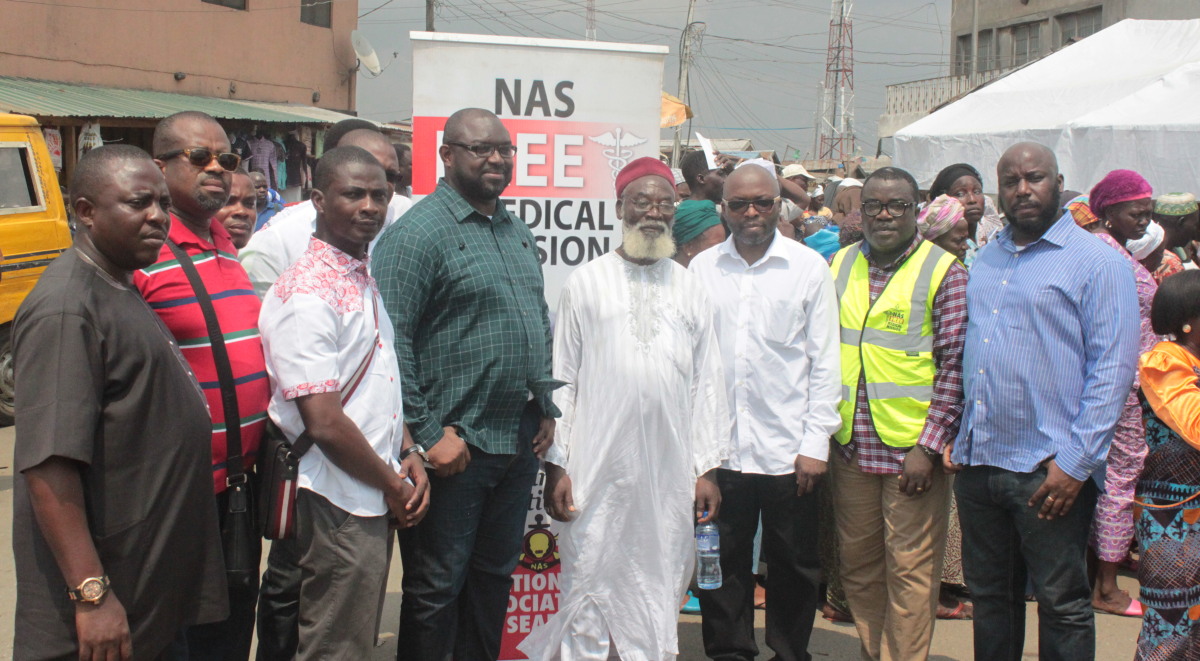
[infogram id=”services_rendered_makoko” prefix=”D9W” format=”interactive” title=”Services Rendered Makoko”] WHY MAKOKO? In 2013, we commissioned a scoping mission for Makoko. The mission identified among other things the grave environmental and hygiene issues which heightens the dire health situation of the area; the level of poverty and lack of a health center was also troubling. The mission services included diabetic screening, dental services, ophthalmic services, general medical & surgical consultations. See below for a summary.
| SUMMARY | ||||
| Number of registered participants | 334 | |||
| Number of participants seen | 304 | |||
| Attrition | 30 | |||
| Attrition rate | 8.9% | |||
The tables below show the distribution of the various services rendered during the Mission
Table 1 shows the demographics of the participants
| DEMOGRAPHICS | PARTICIPANTS | PERCENTAGE |
| Number of Males | 86 | 28.3 |
| Number of females | 218 | 71.7 |
| Total | 304 | |
| Number of Adults | 272 | 89.5 |
| Number of Children | 32 | 10.5 |
| Total | 304 |
Table 2 shows the distribution of participants screened for Diabetes Mellitus
| DIABETES SCREENING | PARTICIPANTS | PERCENTAGE | |
| Diabetes Present | 7 | 3.3* | |
| Diabetes Absent | 208 | 96.7 | |
| Not Screened | 89 | ||
| Total | 304 | ||
| *Prevalence of Diabetes Mellitus was 3.3% | |||
Table 3 shows the distribution of participants screened for Hypertension
| HYPERTENSION SCREENING | PARTICIPANTS | PERCENTAGE | |
| Systolic Hypertension | 117 | 38.5 | |
| Diastolic Hypertension | 77 | 25.3 | |
| Hypertension | 60 | 19.7* | |
| No Hypertension | 244 | 80.3 | |
| Total | 304 | ||
| *Prevalence of Hypertension was 19.7% | |||
Table 4 shows the distribution of participants who had Dental Services
| DENTAL SERVICES | PARTICIPANTS | PERCENTAGE |
| Dental Consultation | 28 | 9.2 |
Table 5 shows the distribution of participants who had Optometry services
| OPTOMETRY SERVICES | PARTICIPANTS | PERCENTAGE | |
| Optometry Consultation | 56 | 18.4 | |
| Free Reading Glasses | 28* | ||
| *Free Reading glasses were given to 28 participants | |||
Table 6 shows the distribution of Insecticide treated nets
| INSECTIDE TREATED NETS | PARTICIPANTS | PERCENTAGE | |
| ITN Distributed | 76* | ||
| ITN Not Distributed | 24 | ||
| Total | 100 | ||
| *ITN were distributed to 76 pregnant women | |||
Table 7 shows the distribution of participants screened for HIV
| HIV SCREENING | PARTICIPANTS | PERCENTAGE | |
| Positive Test | 3 | 3.7* | |
| Negative Test | 78 | ||
| Total Screened | 81 | ||
| Not Screened | 21 | ||
| Grand Total | 100 | ||
| *Prevalence of HIV was 3.7% | |||
[infogram id=”hypertension_screening” prefix=”4Gh” format=”interactive” title=”Hypertension Screening”]